LLM Power and Memory Telemetry: 57 Models, 21,660 Requests
We ran 57 open-weight language models through 380 prompts each on a single local GPU host, capturing per-request power, VRAM and timing telemetry with Marigold. This is the technical writeup: methodology, headline numbers, the failure pattern, the coefficient-of-variation leaderboard and its limitations, and the correlation structure across the dataset.
Data and notebook: github.com/AI-Wales/build-llm-power-sampling.
Two files are published: full-no-response.csv (response text stripped, for a manageable file size) and full-raw.csv (complete).
All figures below are reproducible by running llm_power_analysis.ipynb against full-no-response.csv in the same directory.
Methodology
Every model ran the same set of 380 unique prompts, grouped into five categories: varying_context_short, varying_context_medium, varying_context_long, structured, long_form.
Marigold rejects any model that would require CPU offload under this configuration, so every request in the dataset ran entirely on GPU, and cpu_offload_bytes is zero throughout.
21,660 total rows were captured. 83 are malformed (0.4%) and excluded from every figure below; see Data quality, below. The remaining 21,577 rows are the clean dataset referenced throughout.
Prompt group split (clean dataset): varying_context_long 5,695, varying_context_medium 5,683, varying_context_short 5,670, structured 2,274, long_form 2,255.
Models with less than 20 successful samples are omitted from the final leader board.
One export quirk: the published CSV is UTF-7 encoded, not UTF-8. Opened with a standard UTF-8 reader, the header row looks garbled.
Headline numbers
- 57 unique models, 380 unique prompts, 21,577 usable rows
- Success rate: 99.6% (21,496 succeeded, 81 failed)
- Model size range: 5.1MB to 9.72GB on disk
- Prompt length: 23 to 299 tokens (mean 88)
- Completion length: 1 to 4,000 tokens (mean 535, median 256, capped by
requested_max_tokensin most cases) - Request duration: 0.013s to 322.7s (mean 12.1s, median 3.3s, heavily right-skewed by a small number of slow outliers)
- Power draw, mean per request: 0W to 184.7W (mean 92.6W, median 83.6W)
- Power draw, peak per request: 0W to 232.0W (mean 99.1W, median 84.5W)
- Peak VRAM: up to 11.7GB
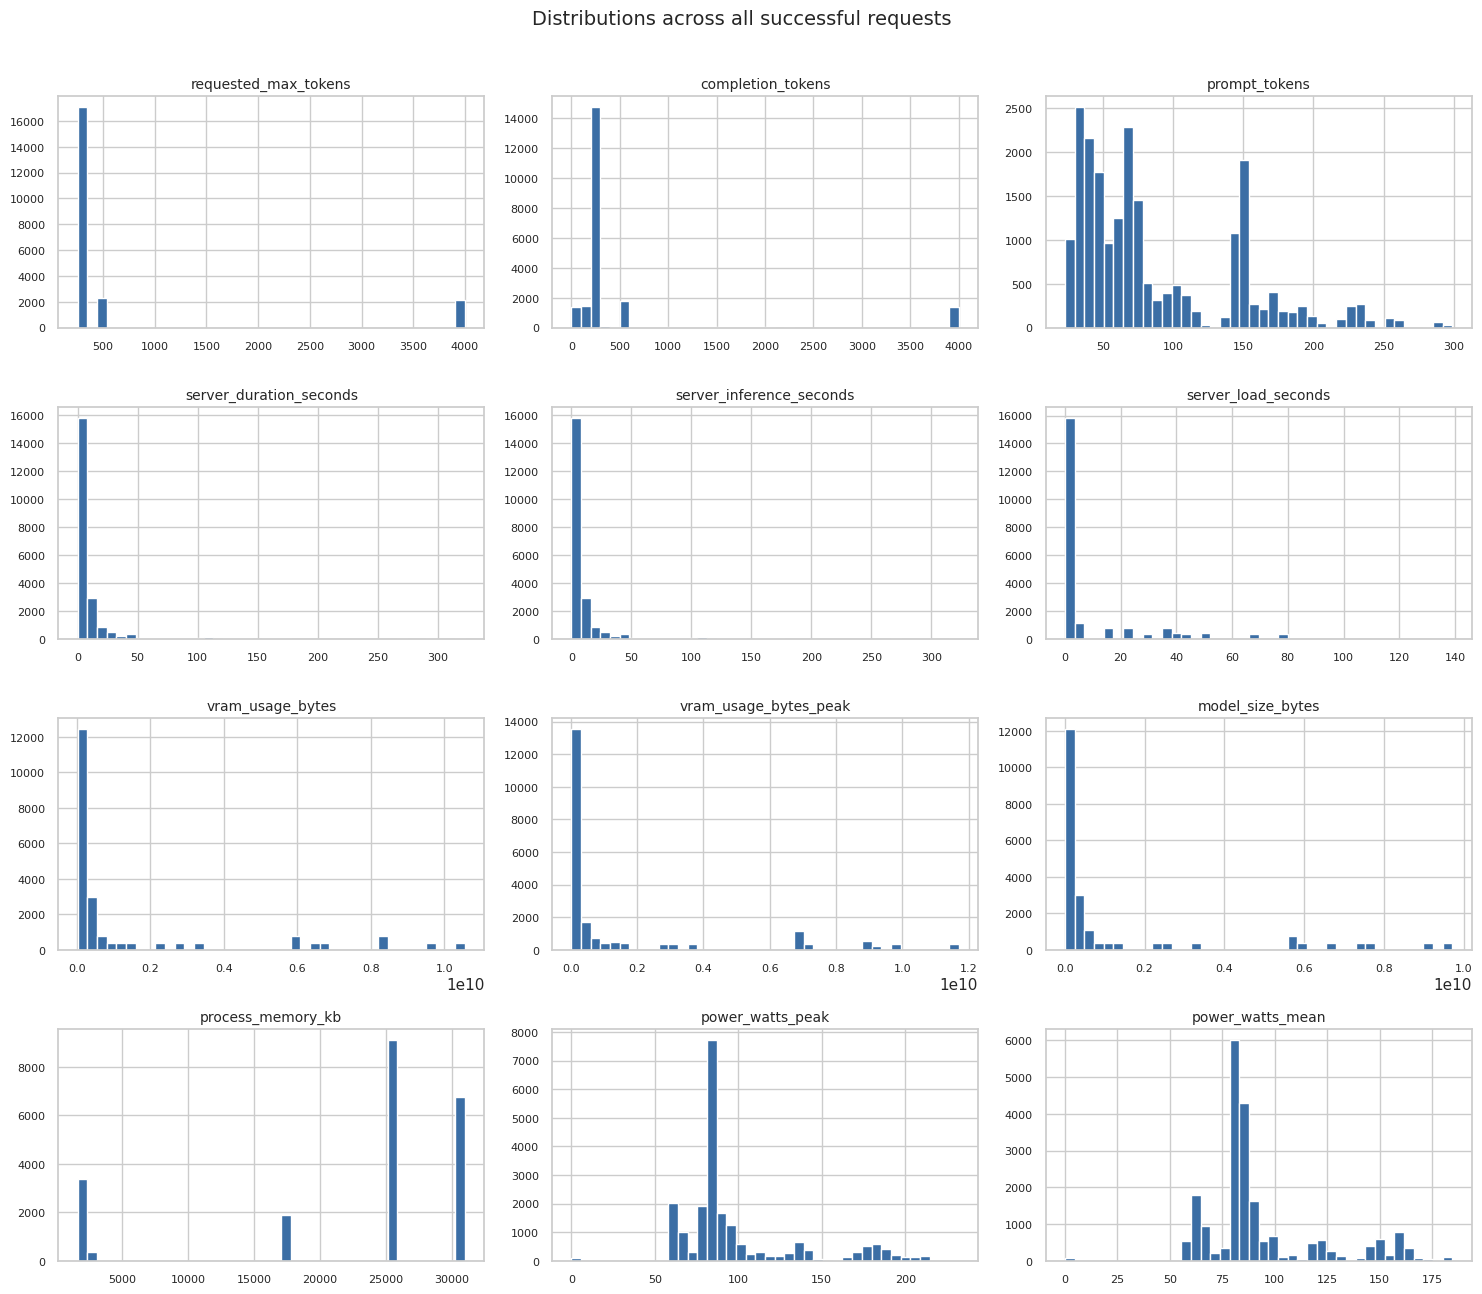
Two shapes stand out. completion_tokens is sharply bimodal, most requests cluster near the 256-token default cap, a smaller group sits near 4,000. power_watts_mean clusters in a band around 80-90W with a long tail out past 150W, consistent with a mix of small and large models in the same run rather than one typical wattage.
The failure pattern
All 81 failures come from exactly two models: facebook/opt-125m (41 failures) and openai-community/gpt2 (40 failures), each with an 89% individual success rate.
80 of the 81 concentrate in the long_form prompt group.
The working assumption was that fine-tuned or non-standard models would be flaky.
The data does not support that. Both failing models are standard base architectures, not fine-tunes, not obscure experimental releases.
The concentration in long_form points towards a context-length ceiling specific to these two older architectures rather than a general reliability problem with fine-tuning.
Confirming the exact mechanism needs the response text, held in full-raw.csv, but not analysed here.
Power draw consistency
The dataset’s central measure is the coefficient of variation (CV, standard deviation divided by mean) of power_watts_mean, computed per model across its successful requests.
Most consistent: cognitivecomputations/dolphin-2.9-llama3-8b (8B parameters), CV 0.74%. Mean power draw 158.98W, standard deviation 1.18W across 380 requests, ranging from 146.7W to 161.1W.
Other models under roughly 1.1% CV: huggingfacetb/smollm2-135m, qwen/qwen3-8b, thingai/quark-135m, thingai/quark-50m, huggingfacetb/smollm-135m.
Most volatile: supralabs/supra-1.5-50m-instruct-exp, CV 43.4%. The model accounts for 60 of the dataset’s 82 zero-power readings (see Data quality, below), and its power-over-time chart shows a flat line around 80W dropping to zero. The cause for this is unsure and requires investigation.
Excluding that case, the next most volatile cluster is entirely sub-3M-parameter experimental models: fromziro/syn-2.6m, harley-ml/dillionv2-1.3m, fromziro/er-tiny-1.3m, each around 28% CV.
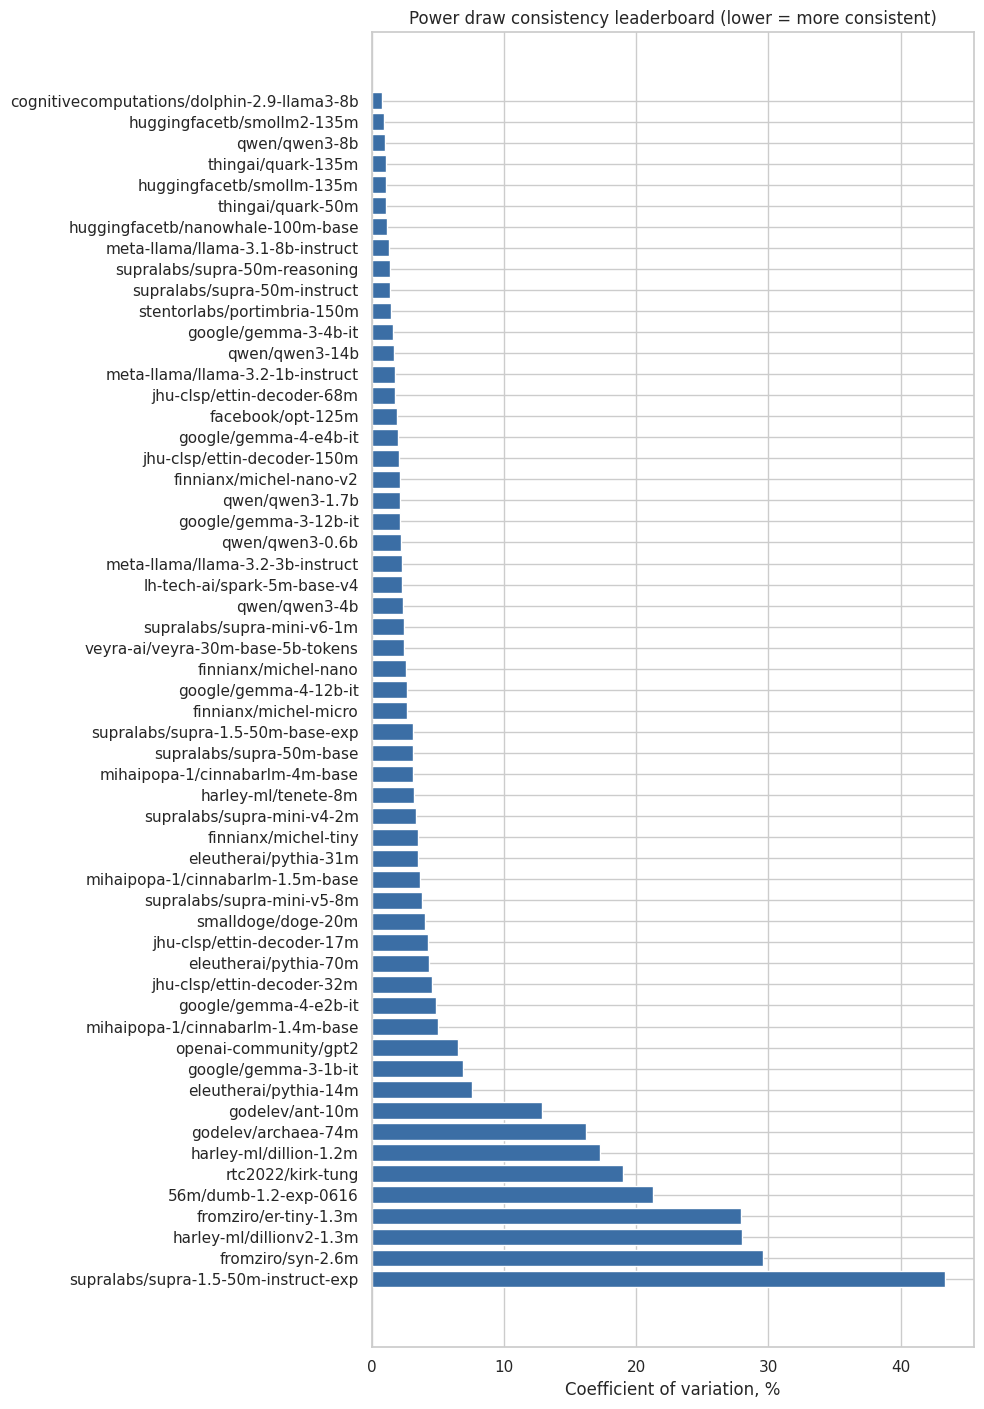
Open question: whether power-draw consistency can be predicted from architecture family or parameter count alone. No working theory yet.
Case study: dolphin vs pythia-14m
eleutherai/pythia-14m is a useful worked example.
On a chart, pythia-14m looks close to a flat line hugging 60W, similarly to dolphin’s flat line around 159W. Dolphin’s CV is 0.74%. Pythia’s is 7.61%, over ten times higher.
| dolphin-2.9-llama3-8b | pythia-14m (all 380 rows) | pythia-14m (2 zero readings excluded) | |
|---|---|---|---|
| mean power | 158.98W | 60.41W | 60.53W |
| standard deviation | 1.18W | 4.60W | 1.33W |
| CV | 0.74% | 7.61% | 2.19% |
| min / max | 146.7W / 161.1W | 0W / 65.0W | – |
A small number of telemetry dropouts can dominate the whole statistic. Pythia has 2 zero-power readings out of 380. Removing those 2 rows drops CV from 7.61% to 2.19%, a nearly fourfold change from 0.5% of the data.
CV is a relative measure, and low-power models are structurally penalised by it. Even with dropouts excluded, pythia’s CV (2.19%) is still roughly three times dolphin’s (0.74%), despite pythia’s absolute jitter being marginally smaller in real terms (1.33W standard deviation against dolphin’s 1.18W). Dividing by the mean means the same amount of watt-level noise reads as a much larger percentage on a model averaging 60W than on one averaging 160W.
CV remains a genuinely useful measure for spotting outliers and flagging telemetry problems. As a leaderboard metric on its own, it structurally favours larger, power-hungrier models.
Correlation matrix
Computed across the twelve usable numeric columns (excluding the constant cpu_offload_bytes), successful requests only.
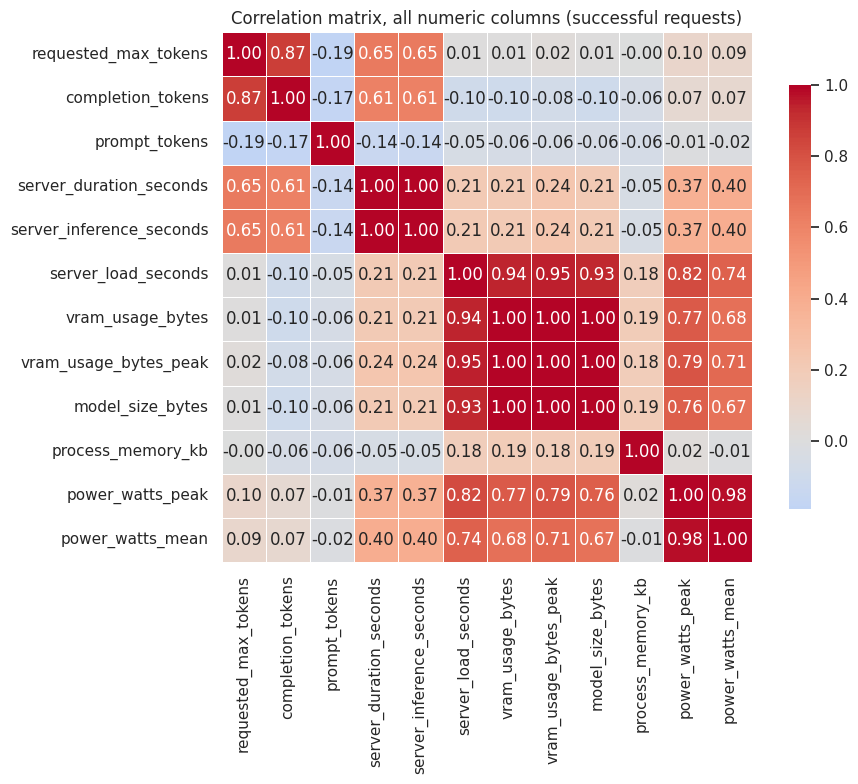
Model size predicts memory and load time almost perfectly, but not power metrics. model_size_bytes correlates at 0.93-1.00 with vram_usage_bytes, vram_usage_bytes_peak, and server_load_seconds, and at only 0.67-0.76 with power_watts_mean and power_watts_peak.
Peak and mean power draw move together, as expected. 0.98 correlation between power_watts_peak and power_watts_mean.
Completion length is driven by the token cap, not the prompt. requested_max_tokens and completion_tokens correlate at 0.87. prompt_tokens correlates weakly and negatively with almost every other column, from -0.19 to -0.01. In this dataset, prompt length does not meaningfully drive resource usage.
A benchmark built to vary prompt length across a wider range, independent of completion cap, would be needed to isolate the KV-cache effect from the completion-length effect visible here.
Data quality
The dataset is published pre-cleaned.
- 83 malformed rows (0.4%). An unescaped comma in a text field, most likely the
errorfield or a leftover fragment ofraw_response, shifts values sideways, so a column likehttp_statusends up holding text instead of a number. Needs a CSV-quoting fix at source. Excluded from every figure above. - The
errorfield is coarse. All 81 failures record the identical string,job status=error. This is a gap in the benchmark harness’s logging rather than a data entry mistake. The dataset can tell you that something failed, and which model and prompt group it happened in, but not yet why. http_statusis not a useful success signal. It reads 200 even on rows wheresuccessis False, because it reflects the API responding correctly rather than the model response.cpu_offload_bytesis always zero. In this configuration, Marigold refuses to run any model that would need offloading to the CPU. The column is an assertion that every request ran entirely on GPU, not a bug.- A telemetry gap. 82 rows have
power_watts_meanexactly 0. 60 of the 82 come from one model,supralabs/supra-1.5-50m-instruct-exp. Its power-over-time chart shows a flat line dropping to zero unexpectedly.
Open questions
- Can power-draw consistency (CV) be predicted from architecture family or parameter count, independent of the scale effect described above?
- What specifically causes
opt-125mandgpt2to fail on long-form prompts? The response text infull-raw.csvshould confirm whether this is a context-length ceiling or something else. - Is CV the right metric here at all, given it is demonstrably sensitive to both telemetry glitches and absolute power scale? A normalised or outlier-robust variant might tell a fairer story.
Raw CSVs, the analysis notebook, and the full model list are on GitHub. Telemetry captured with Marigold available at github.com/bayinfosys/marigold).